locations of the stars in the universe are shown on this chart.
hr chart
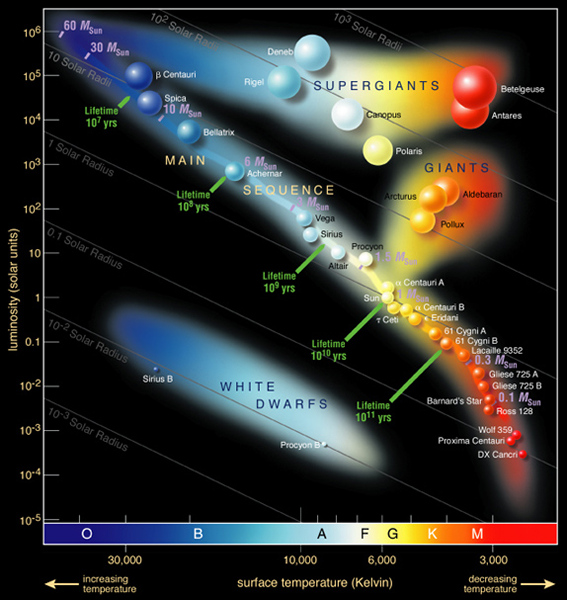
The Hertzsprung Russel diagram was discovered by two astronomers in 1912The Danish astronomer Einar Hertzsprung and American astronomer Henry Norris Russel noticed that the luminosity of stars decreased from spectral class type O to M. They put luminosity on the y axis and put stellar temperature on the x axis HR chart show the luminosity and temperature of the stars of stars in the universe. This was created to organize stars and find out the grouping of stars in the universe. HR chart does not show the location of stars it only measures their temperature which can be found easier by color and luminosity. The HR chart represents a step in the understanding of stellar evolution or the way in which stars undergo change.
questions
1. Where are the white dwarfs located at
2. Where are the main sequence in spectral class located at?
3 where are the red super giants at?
